> ## Documentation Index
> Fetch the complete documentation index at: https://data.ornn.com/docs/llms.txt
> Use this file to discover all available pages before exploring further.
# Pull price history into pandas
> Load a GPU price series into a pandas DataFrame and plot it.
This guide loads an H100 SXM price history into a pandas DataFrame, ready for analysis or plotting.
## Prerequisites
* An [API key](/docs/manage-api-keys).
* `pip install requests pandas`
## Fetch and load
The [`/history-simple`](/docs/api-reference/historical-prices/get-a-clean-dailyhourly-series) endpoint returns a clean `timestamp` / `index_value` series, ideal for a DataFrame.
```python theme={null}
import requests
import pandas as pd
API_KEY = "YOUR_API_KEY"
BASE = "https://api.ornnai.com"
resp = requests.get(
f"{BASE}/api/gpu/H100 SXM/history-simple",
params={
"startDate": "2026-05-01",
"endDate": "2026-05-31",
"granularity": "daily", # one point per day
"limit": 500, # default is 100, raise it for long ranges
},
headers={"Authorization": f"Bearer {API_KEY}"},
)
resp.raise_for_status()
df = pd.DataFrame(resp.json()["data"])
df["timestamp"] = pd.to_datetime(df["timestamp"])
df = df.sort_values("timestamp").set_index("timestamp")
print(df.head())
```
```text Output theme={null}
index_value
timestamp
2026-01-01 00:00:00+00:00 2.00
2026-01-02 00:00:00+00:00 2.00
2026-01-03 00:00:00+00:00 2.00
2026-01-04 00:00:00+00:00 2.00
2026-01-05 00:00:00+00:00 2.00
```
The API returns points most-recent-first. Sorting by `timestamp` (as above) puts them in chronological order before any rolling calculations or plotting.
## Plot it
```python theme={null}
import matplotlib.pyplot as plt
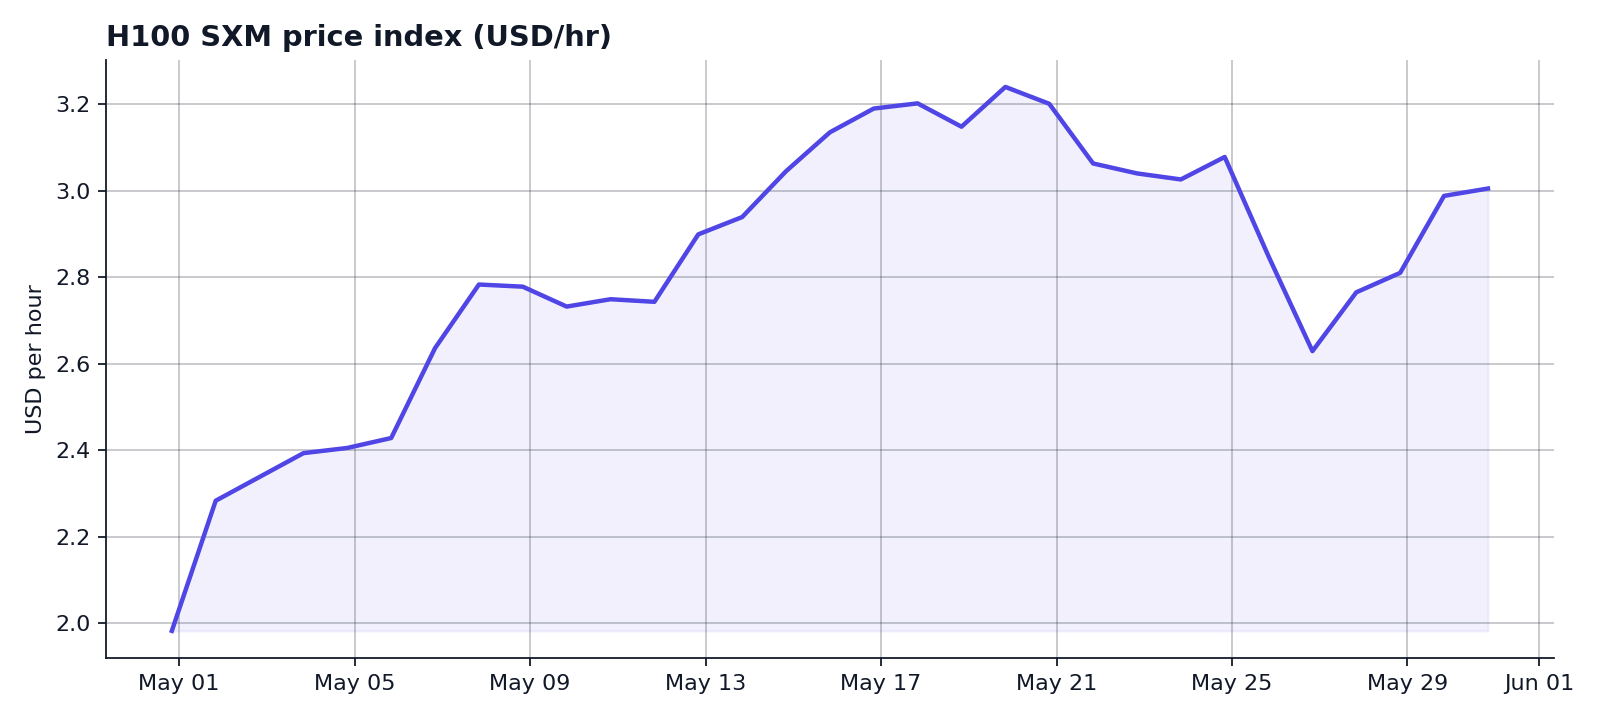
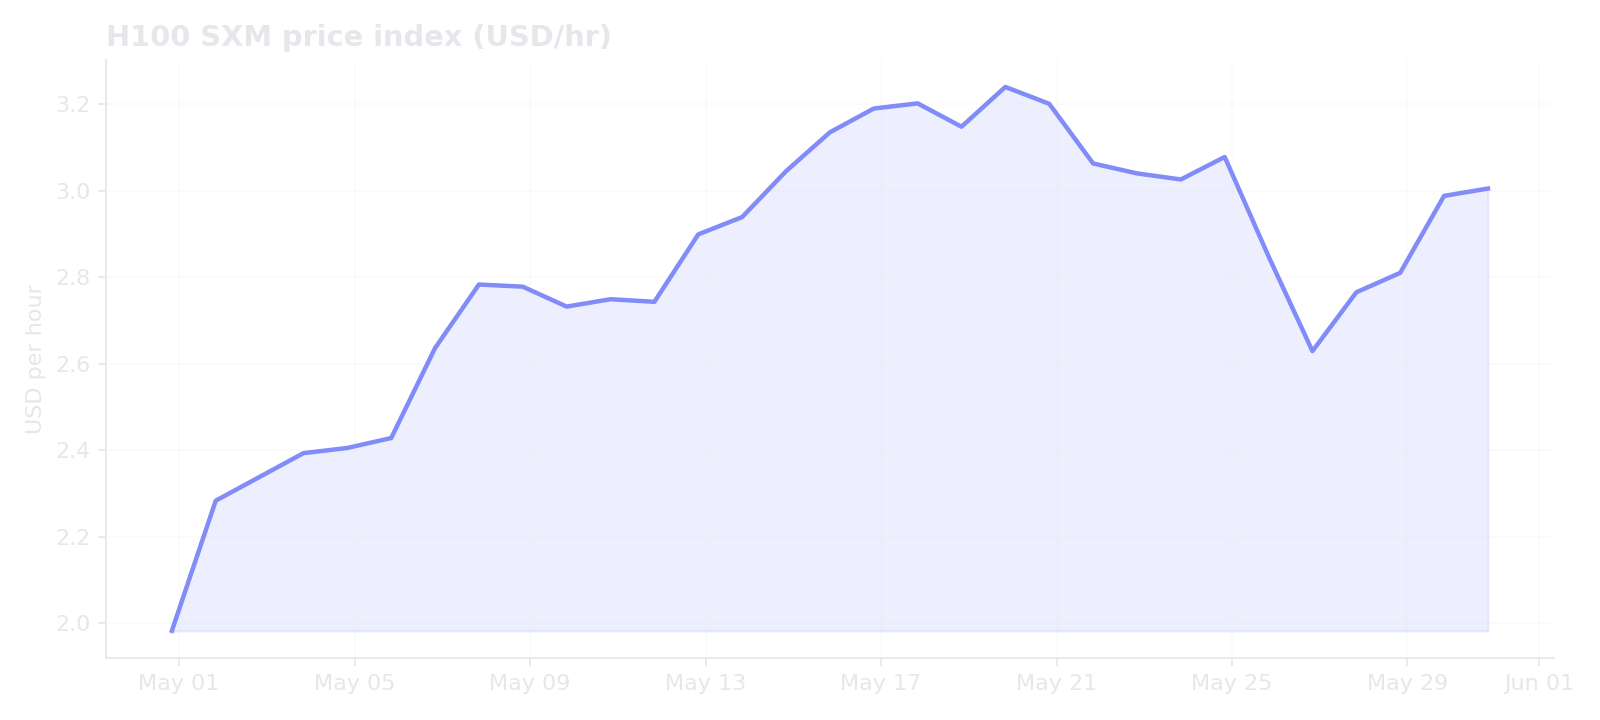
df["index_value"].plot(title="H100 SXM price index (USD/hr)")
plt.ylabel("USD per hour")
plt.show()
```
 ## Compare multiple GPUs
```python theme={null}
gpus = ["H100 SXM", "H200", "B200"]
frames = []
for gpu in gpus:
r = requests.get(
f"{BASE}/api/gpu/{gpu}/history-simple",
params={"startDate": "2026-05-01", "endDate": "2026-05-31",
"granularity": "daily", "limit": 500},
headers={"Authorization": f"Bearer {API_KEY}"},
)
s = pd.DataFrame(r.json()["data"])
s["timestamp"] = pd.to_datetime(s["timestamp"])
frames.append(s.set_index("timestamp")["index_value"].rename(gpu))
prices = pd.concat(frames, axis=1).sort_index()
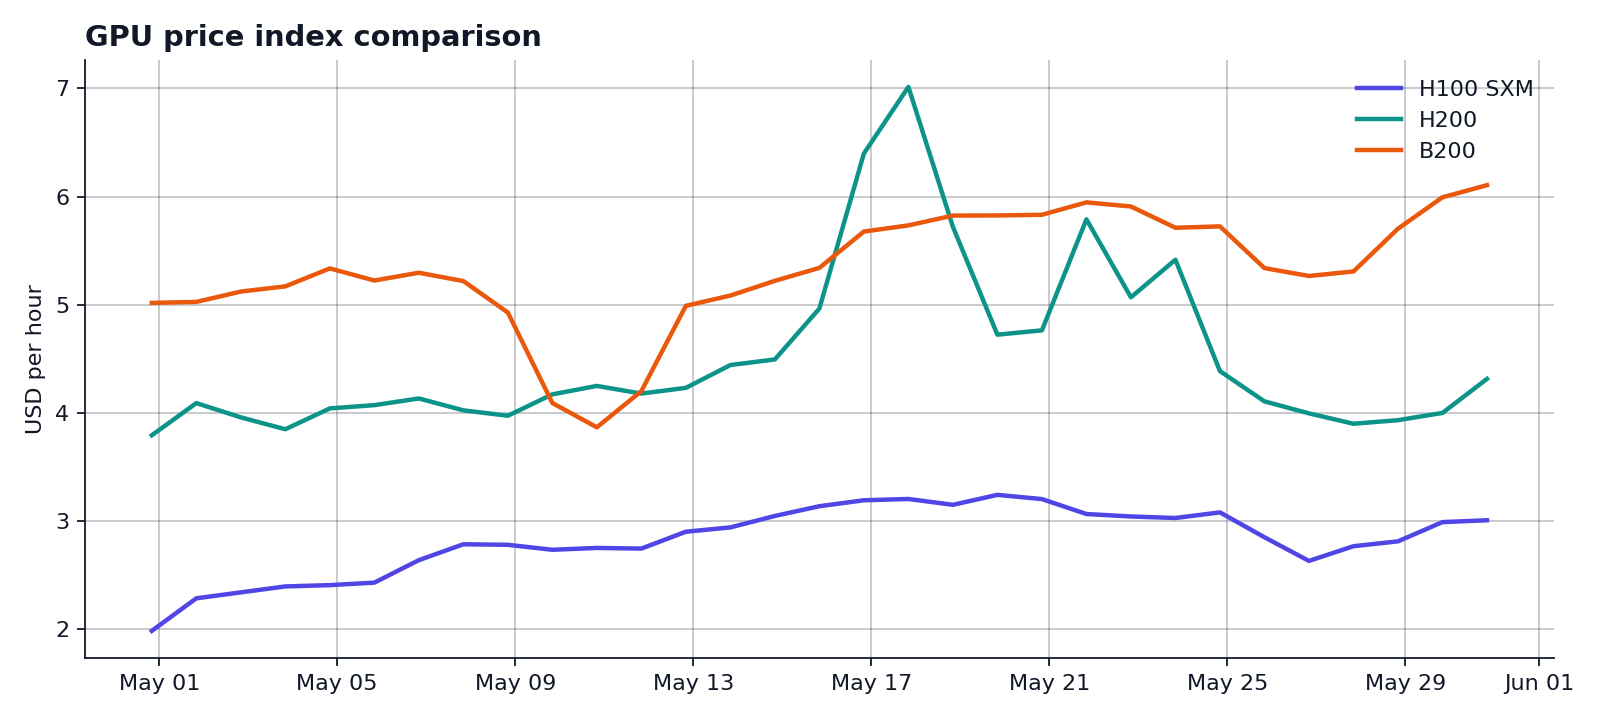
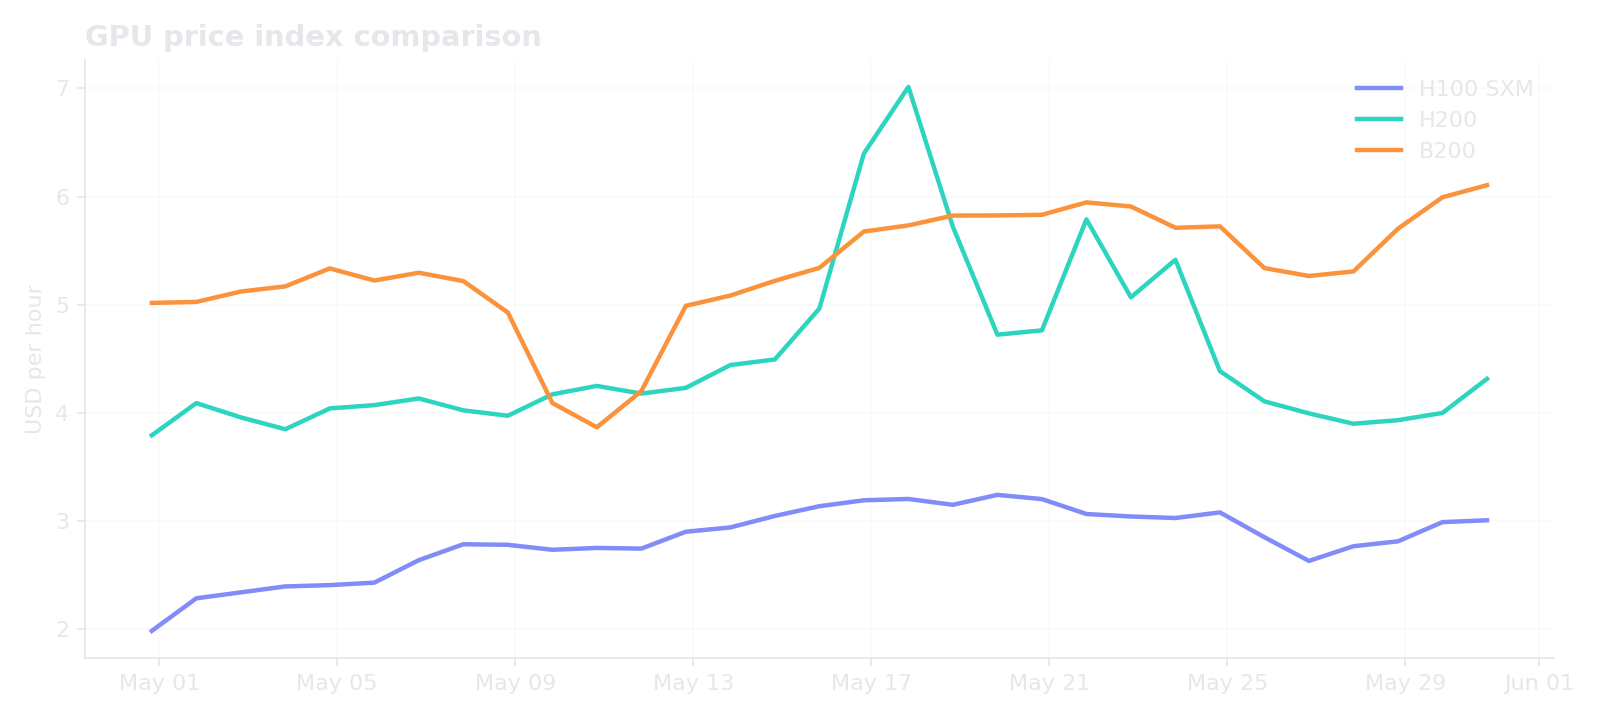
prices.plot(title="GPU price index comparison")
```
## Compare multiple GPUs
```python theme={null}
gpus = ["H100 SXM", "H200", "B200"]
frames = []
for gpu in gpus:
r = requests.get(
f"{BASE}/api/gpu/{gpu}/history-simple",
params={"startDate": "2026-05-01", "endDate": "2026-05-31",
"granularity": "daily", "limit": 500},
headers={"Authorization": f"Bearer {API_KEY}"},
)
s = pd.DataFrame(r.json()["data"])
s["timestamp"] = pd.to_datetime(s["timestamp"])
frames.append(s.set_index("timestamp")["index_value"].rename(gpu))
prices = pd.concat(frames, axis=1).sort_index()
prices.plot(title="GPU price index comparison")
```